
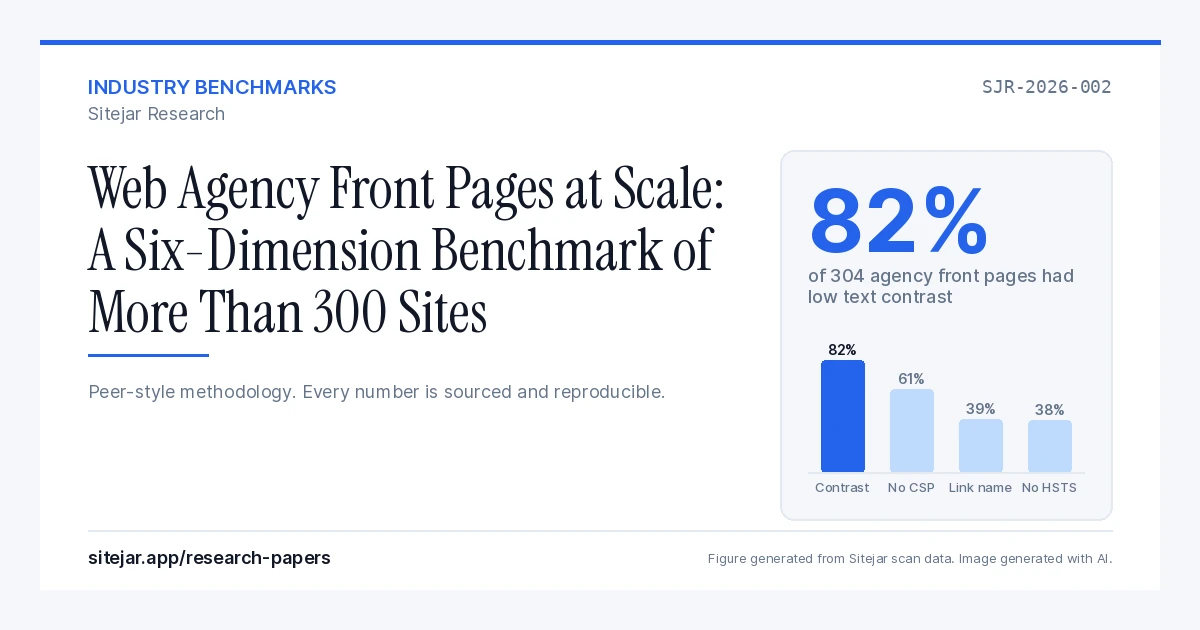
This paper reports a single-page compliance scan of more than 300 web agency front pages, carried out between 16 September and 23 October 2026 with the Sitejar scanner. After one site belonging to the authors was excluded, the sample consisted of 304 third-party agency websites, each represented by one read-only scan of its front page across six dimensions: accessibility, security, privacy, deceptive design, technical quality and SEO. The sample extends the 57 sites of an earlier study (SJR-2026-001) roughly fivefold. All figures are Sitejar internal data; no site is named and no published row describes fewer than five sites. At most one of the 304 front pages reached full marks in accessibility (99.7% or more fell short), 91% fell short in security and 85% in privacy. Low text contrast was the most widespread single finding, present on 82% of sites (95% CI 77.5 to 86.1), followed by a missing Content-Security-Policy header on 61% (55.6 to 66.5) and links without a discernible name on 39%. Tracking that began before any consent choice appeared on at least a fifth of sites. Deceptive design produced no findings at all, a result the paper attributes to the limits of a front-page scan. Compared with the web as a whole, agency front pages carried low contrast text at almost the same rate but showed far fewer structural accessibility failures and wider adoption of security headers. The full method is published so the study can be repeated.
Introduction and research questions
Why scan web agency front pages again, at five times the size?
The first study in this series measured 57 web agency front pages and found that every one of them carried at least one accessibility finding. That result was striking, and it was also fragile. A sample of 57 is enough to say that a failure is common, but not enough to say how common with any precision. In the first paper, the share of sites missing a Content-Security-Policy header was 70%, and the 95% confidence interval around that figure ran from about 57% to about 80%. A reader could fairly ask whether the true figure for the segment was closer to the bottom of that range or the top, and the first study could not answer. The same was true of every row it published.
This paper exists to narrow those intervals. It keeps the method of the first benchmark of 57 web agency front pages unchanged and grows the sample to 304 third-party sites, so that each percentage now carries an interval of roughly plus or minus five points rather than plus or minus twelve. A larger sample also brings into view findings that were too rare to publish before. The first study withheld twenty findings for appearing on fewer than five sites; this one publishes twenty-five findings, ten more than before, because the larger base lifts more of them over the threshold.
The segment itself is unchanged, and so is the reason for studying it. Web agencies sell the expertise that accessibility, security and privacy require. Their front pages are the shop window in which clients judge them. If any group of sites should be expected to meet the standards professional buyers now ask about, it is this one. A benchmark of the professionals is therefore a benchmark of the ceiling: where agency sites fall short, the average client site is unlikely to do better.
What questions does this study answer?
The research questions were four. First, across the six dimensions, where do web agency front pages stand, and which dimension is weakest? Second, which individual findings are most widespread, and how precisely can their prevalence now be estimated? Third, do the estimates from the 57-site study hold up when the sample grows, or did the smaller sample overstate or understate particular failures? Fourth, and as important as the others, what can a single read-only scan of a front page legitimately claim, and what must be left to human review or a fuller crawl?
The fourth question governs the reading of the other three. A front-page scan measures a great deal, but it measures one page, once, by machine. Each section below returns to that boundary rather than letting the size of the sample obscure it.
Data and methodology
How was each site scanned?
Every measurement in this paper comes from the Sitejar scanner, run by the authors. A scan loads the target URL in a real, headless browser, waits for the page to render including its JavaScript, and then evaluates the rendered document, the network requests the page made, the response headers it received and the consent behaviour observed during load. The output for a page is a set of findings. Each finding is mapped to the standard or instrument it fails, carries a severity rating, and carries a confidence label. The scanner does not modify the page, submit any form, follow any link, click any consent control or attempt to log in. It reads what a first-time visitor's browser would receive before that visitor does anything.
Exactly one scan per site was counted, against the front page only. No crawl was attempted and no internal page was visited. Where a site had been scanned more than once during the collection window, the earliest complete scan was kept and the others discarded, so that each site contributes one row to every count. The scanner honoured each site's robots directives. Sites that disallow automated visits were not scanned, which shapes the sample in a way discussed under limitations.
What do the six dimensions measure?
Accessibility evaluates the rendered page against WCAG-aligned rules: text contrast, text alternatives for images, form labelling, accessible names on links and controls, heading structure, landmark regions, the viewport configuration, ARIA usage and keyboard reachability of scrollable regions, among others. Security examines response headers and transport, including the presence of Content-Security-Policy and Strict-Transport-Security headers and whether any form on the page submits sensitive fields with a GET request. Privacy observes consent timing: whether third-party cookies are set, and whether tracking scripts load, before a visitor has made any consent choice. Deceptive design looks for interface patterns of the kind regulators pursue, such as pre-checked consent and asymmetric prominence between accept and reject controls. Technical quality covers markup validity, broken references and page weight, including oversized images. SEO covers on-page fundamentals such as the title, description and heading presence.
Each dimension yields a score from 0 to 100 for the page, where 100 means the scanner found nothing to report in that dimension. The calibration of these scores against reference sites is described on the Sitejar transparency page. Scores are the scanner's own summary and should not be compared numerically with scores from other tools; the individual findings, each tied to a named rule, travel better.
What is in the sample, and what was excluded?
The collection window ran from 16 September to 23 October 2026. In that window, 305 front pages were scanned under the study protocol: 304 third-party websites selected as web design or development agencies, plus one site belonging to the authors. The authors' site was excluded from every share reported in this paper, leaving 304 third-party agency websites. The 57 sites of the earlier study are included among the 304; the earlier sample was extended rather than replaced, which matters for the comparison in the results section. Dry runs, meaning test scans in which known findings are replayed against another domain for validation, were screened for and none were present, so no row was removed on that ground.
Across the scans, the mean number of findings per site was 14.0 and the median was 14. Mean and median sit together, as they did in the first study (13.7 and 14), which indicates that the distribution of findings is not dominated by a handful of extreme sites.
How were the published figures computed after the exclusion?
The raw tallies were computed over all 305 scans. Removing the authors' own site changes the denominator from 305 to 304 exactly, because it is known that 304 of the sites belong to third parties. It can change a numerator by at most one, and only for a finding the excluded site itself carried. To keep every published figure true whichever way that falls, shares in this paper are calculated on 304 sites and reported to the whole percentage point. For each share, both possible numerators were checked. Where both round to the same whole number, that number is given. Where they straddle a rounding boundary, the paper gives both, for example 29% to 30%. No share in this paper can be wrong by more than half a percentage point as a result of the exclusion.
Dimension scores are handled differently. The worst, median and best scores are reported as computed over all 305 scans. Removing a single site from 305 cannot move a median by more than half the difference between two neighbouring scores in the sorted list, and cannot change a worst or best value unless the excluded site held that value. Where this matters for interpretation, it is said at the point of use.
Confidence intervals are 95% Wilson score intervals on n = 304, computed from the larger of the two possible numerators. Their width, typically eight to eleven points for findings above 20% prevalence, is the honest measure of how far the sample can be trusted to stand in for the segment, and it should be kept in mind wherever a percentage appears.
What publication rules were applied?
Four rules were fixed before any figure was written. No site is named, including any of the sites in the authors' wider scan database. No published row describes fewer than five sites; twenty-eight findings were withheld for that reason alone, because on a sample of this size a finding present on two or three sites comes close to identifying them. Every number is from a scan the authors ran. Where the paper cites external work, it says so and links the source, and every internal figure is labelled as Sitejar scan data.
What do the confidence labels mean?
The scanner attaches one of three labels to every finding. Confirmed means the rule is deterministic and the failure is certain from the rendered page alone, for example a header absent from the response, or a form field with no accessible label in the DOM. Likely means the rule fired but a person could reasonably reach a different conclusion on inspection. Needs review means the scanner has flagged something it cannot decide and is asking for a human. The results report, for each finding, both the share of sites on which it was present at all and how much of that presence was Confirmed, so the reader can see how much of each figure rests on certainty.
Results
How did agency front pages score across the six dimensions?
The six dimensions are reported in order of weakness, with the share of the 304 third-party sites that fell short of full marks and the worst, median and best scores across the scans.
Accessibility was the weakest dimension by every measure. The worst score was 47, the median 80 and the best 100. Exactly one of the 305 scanned front pages reached 100. Because the paper does not publish which site that was, the supportable statement for the third-party sample is that at most one of the 304 agency front pages reached full marks, and at least 303 of 304 (99.7% or more; 95% CI lower bound 98.2%) carried at least one accessibility finding. In the first study, all 57 of 57 fell short. A fivefold larger sample has not found more than a single exception.
Security was second. The worst score was 39, the median 74 and the best 100. Of the 304 sites, 91% fell short of full marks (95% CI 87.8 to 94.1).
Privacy had the widest spread and the lowest single score in the study. The worst score was 24, while the median was 88 and the best 100. Of the 304 sites, 85% fell short of full marks (80.8 to 88.7). The median privacy score of 88 is higher than the 78 recorded in the first study; the shares falling short are almost identical (84.2% then, 85% now), which suggests that the typical failing site in the larger sample fails by less, not that fewer sites fail.
Technical quality was better. The worst score was 59, the median 94 and the best 100, with 84% of sites short of full marks (79.7 to 87.9).
SEO was close to clean. The worst score was 94, the median 100 and the best 100. Only 12% of sites fell short (9.0 to 16.3), and none by more than six points.
Deceptive design was entirely clean. Every scan scored 100 and no site fell short. With zero events in 304 trials, the upper bound of the 95% interval for the true rate on agency front pages is 1.2%. The interpretation of this result is taken up in the discussion, because it is not the same as saying these agencies never use deceptive patterns.
Which findings were most common?
Twenty-five findings were present on at least five sites and are reported here, ordered by prevalence. Each is given with its dimension, the scanner's severity rating and its share of the 304 sites with a 95% interval. Unless stated otherwise, the finding was Confirmed on every site where it appeared.
Low text contrast, an accessibility finding rated high, was the most widespread finding in the study, present on 82% of sites (77.5 to 86.1). It was Confirmed on about 97% of the sites that carried it. On eight or fewer, the label was Likely or Needs review, for reasons described in the discussion.
A missing Content-Security-Policy header, a security finding rated high, was present on 61% (55.6 to 66.5).
A link without a discernible name, an accessibility finding rated high (rule identifier Link Name), was present on 39% (33.8 to 44.7).
A missing Strict-Transport-Security header, a security finding rated high, was present on 38% (32.9 to 43.7).
Page content outside any landmark region, an accessibility finding rated medium (rule identifier Region), was present on 36% (31.0 to 41.7).
No link to an accessibility statement, an accessibility finding rated medium, was present on 29% to 30% (24.8 to 35.0).
A third-party cookie set before consent, a privacy finding rated medium, was present on 21% to 22% (17.4 to 26.7).
A tracking script loading before consent, a privacy finding rated high, was present on 21% (17.1 to 26.3).
A form field missing a label, an accessibility finding rated high, was present on 20% (15.9 to 24.9).
A button or control missing an accessible name, an accessibility finding rated high, was present on 12% to 13% (9.5 to 17.1).
Sensitive form data submitted with a GET request, a security finding rated high, was also present on 12% to 13% (9.5 to 17.1).
A skipped heading level, an accessibility finding rated medium, was present on 12% (9.0 to 16.3).
Missing alt text on an image, an accessibility finding rated high, was present on 11% (7.8 to 14.9).
A viewport configuration that blocks zooming, an accessibility finding rated critical (rule identifier Meta Viewport), was present on 7% (4.8 to 10.7). It is the more prevalent of the two reported findings that carry the critical rating.
An oversized image, a technical quality finding rated medium, was present on 7% (4.6 to 10.3).
A scrollable region that cannot be reached by keyboard, an accessibility finding rated high (rule identifier Scrollable Region Focusable), was present on 6% to 7% (4.3 to 9.9).
A link inside a block of text that is distinguishable only by colour, an accessibility finding rated high (rule identifier Link In Text Block), was present on 6% (3.8 to 9.2).
Landmarks that are not uniquely labelled, an accessibility finding rated medium (rule identifier Landmark Unique), were present on 5% to 6% (3.5 to 8.8).
An ARIA attribute used on an element where it is not permitted, an accessibility finding rated high (rule identifier Aria Prohibited Attr), was present on 5% (3.3 to 8.4).
Interactive controls nested inside one another, an accessibility finding rated high (rule identifier Nested Interactive), were present on 5% (3.0 to 8.0).
An ARIA role missing the child elements it requires, an accessibility finding rated critical (rule identifier Aria Required Children), was present on 4% to 5% (2.8 to 7.6).
A list marked up incorrectly, an accessibility finding rated high (rule identifier List), was present on 4% (2.3 to 6.8).
Total page weight above the scanner's threshold, a technical quality finding rated medium, was present on 3% to 4% (2.0 to 6.4).
An empty alt attribute on an image that appears to carry information, an accessibility finding rated medium, was present on 3% (1.8 to 5.9). It was Confirmed on none of those sites. Every instance carried a lower confidence label, and the reason is the subject of a section below.
An element hidden from assistive technology that can still receive keyboard focus, an accessibility finding rated high (rule identifier Aria Hidden Focus), was present on 3% (1.8 to 5.9).
Of the twenty-five reported findings, eighteen are accessibility findings, three are security, two are privacy and two are technical quality. No deceptive design or SEO finding reached the five-site threshold. Twenty-three of the twenty-five were Confirmed on every site where they appeared. The two exceptions are low text contrast, Confirmed on about 97% of its sites, and the empty alt finding, Confirmed on none.
How common was tracking before consent?
The two consent findings deserve to be read together, because each describes the same underlying event from a different angle: the page began collecting data about a visitor before that visitor had chosen anything. A third-party cookie set before consent appeared on 21% to 22% of sites and a tracking script loading before consent on 21%. The published tallies do not record how many sites carried both, so the share of sites with either cannot be stated exactly. It is bounded. It cannot be lower than the larger of the two shares, 21% to 22%, and cannot be higher than their sum, 42% to 43%. The conservative statement is that at least a fifth of agency front pages began tracking before consent, and the true share may be close to twice that.
Did the 57-site estimates hold up?
Because the 57 sites of the first study are part of the present sample, the larger sample is not an independent replication. It is, however, possible to separate the two. Under the deduplication rule, each of the 57 sites contributes the same earliest scan to both studies, so subtracting the first study's published counts from the present tallies yields the figures for the 247 third-party sites added since. These derived figures carry the same plus-or-minus-one uncertainty as the rest of the paper, and they are reported here to the whole percentage point.
On the eight most common findings that both studies report, the added sites look much like the original ones. Low text contrast was present on 79% of the original 57 and on 83% of the added 247. Links without a name: 40% then, 38% to 39% among the added sites. Missing HSTS: 32% then, 39% to 40% now. Content outside landmarks: 33% then, 36% to 37% now. No accessibility statement link: 35% then, 28% now. The largest movements were in the missing Content-Security-Policy header, which fell from 70% in the original sample to 59% among the added sites, and in third-party cookies before consent, which fell from 28% to 20%. Tracking scripts before consent moved the other way, from 16% to 22% to 23%.
None of these movements is larger than the first study could have produced by chance. For each of the eight findings, the share among the added 247 sites falls inside the 95% interval the first study's own sample size implies. The CSP figure is the closest call: the first study's interval for its 70% ran from 57.3% to 80.5%, and the added sites came in at 59%, near the bottom. The plain reading is that the first study's headline numbers were directionally right, and that its CSP estimate was probably high. The present figure of 61% on 304 sites supersedes it.
One smaller finding did not hold as well. A scrollable region that cannot be reached by keyboard was reported on 12% of the original 57 sites (95% CI 6.1 to 23.2) but appeared on only about 5% of the added 247, just below that interval. The difference is at the edge of what chance could explain, and the present estimate of 6% to 7% on 304 sites replaces the earlier one. The claim that the first study held up is therefore limited to the eight most common findings.
Discussion
Why do agency front pages fail contrast at the same rate as the whole web?
The central comparison in this paper is with the WebAIM Million, the largest public study of home page accessibility. According to the WebAIM Million 2026 report, based on an analysis in February 2026, 95.9% of the top one million home pages had at least one detected WCAG failure, with an average of 56.1 detected errors per page, and low contrast text appeared on 83.9% of them. The present study found low text contrast on 82% of agency front pages. The two studies use different scanners and different rule sets, so the figures are not directly comparable, but the closeness is hard to dismiss. On the single most common accessibility failure on the web, the people who build websites for a living fail at a similar rate to everyone else.
The reason is visible in how the failure arises. Low contrast is rarely a failure of skill. It is a design decision applied systematically: a light grey chosen for captions, placeholders or a footer, defined once as a colour token and inherited everywhere. Agency sites are design-led, and the visual vocabulary that reads as refined on a large, bright monitor, thin type and soft greys, is exactly the vocabulary that fails a 4.5:1 ratio. The fix is usually equally systematic: one token changed at the source, as set out in our guide to fixing low color contrast. That a single shared value can produce a finding on four out of five professional sites says more about how design systems propagate decisions than about the care any one agency takes.
Where do agencies do better than the web at large?
On other accessibility failures, the picture is markedly different. The WebAIM Million reports missing alternative text on 53.1% of home pages, missing form input labels on 51%, empty links on 46.3% and empty buttons on 30.6%. The nearest equivalents in this study were missing alt text on 11% of agency front pages, a form field missing a label on 20%, links without a discernible name on 39% and buttons or controls missing an accessible name on 12% to 13%. Rule definitions differ between the two studies, and a home page in the top million is a different object from an agency's front page, which is often lighter and carries fewer forms. Still, the gap on alt text and form labels is wide enough that it is unlikely to be an artefact of method alone. Agency front pages carry fewer of the structural failures that come from unlabelled markup, and roughly the same rate of the one failure that comes from visual design.
Security headers show a similar pattern. According to the HTTP Archive Web Almanac 2025 security chapter, adoption of Content-Security-Policy across the pages it crawled rose from 18.5% the previous year to 21.9%, and Strict-Transport-Security was present on up to 36% of pages visited on mobile. In the present sample, 61% of agency front pages lacked a CSP, which means about 39% had one, and 38% lacked HSTS, which means about 62% sent it. The Almanac measures a far larger and more varied crawl, including pages other than home pages, so again the comparison is directional rather than exact. In that direction, agency sites send these two headers at higher rates than the web as a whole. They still leave a majority without a CSP, the primary browser-side control on where scripts may load from. The detail of what each header should contain is covered in our complete checklist for HTTP security headers, and the free security headers checker reports the headers any single page sends.
What does the consent result mean in practice?
The consent findings carry legal weight that the others do not, because timing is the fact on which consent enforcement and litigation turn. Under the opt-in frameworks in force in the EU and the United Kingdom, a non-essential cookie set before the visitor's choice is the violation itself, and in the United States, plaintiffs in California have built claims around tracking pixels and session replay that fire on page load. The regional rules are set out in our region-by-region guide to cookie consent, and the litigation pattern in our piece on reducing CIPA risk from session replay and pixels. This paper does not assess whether any site breaches any law; it records that at least a fifth of agency front pages began tracking before a choice was made.
What makes the finding persistent is that it is invisible to the site owner. A banner appears, the owner sees it, and the reasonable assumption is that the banner governs what loads. The scanner observes the network requests and can see that, on these sites, it does not: the tracker fired before the banner could be answered. The same check can be run on any single page with the free cookie consent checker, which loads the page once without clicking anything and reports what was set before any choice.
Why was deceptive design clean, and SEO nearly so?
Every one of the scans scored 100 in deceptive design, and 88% of sites scored 100 in SEO. It would be easy, and wrong, to read these rows as evidence that web agencies avoid deceptive patterns and excel at SEO.
The correct reading starts from what was scanned. The deceptive patterns regulators pursue, pre-checked consent boxes, drip pricing at checkout, obstructed cancellation, confirmshaming decline buttons, live in flows: a checkout, a subscription form, an account settings page. A web agency's front page has none of those. It is a portfolio, a services summary and a contact form. On these pages, the scanner's deceptive design rules had very little surface to test, and a score of 100 means nothing was found where there was little to find. The same caution applies, less strongly, to SEO. Front-page fundamentals such as a title and description are what a professional site is most likely to get right, and the check does not reach the deeper pages where SEO problems accumulate. A sample five times larger did not change this result, and it would not be expected to: the limitation is in the page type, not the sample size. Technical quality was less clean, with page weight among its findings; the practical fixes for page weight and Core Web Vitals are set out in a separate guide.
What does a Confirmed finding mean, and why do two findings fall short of it?
Because the results lean on the word Confirmed, precision about it matters. A Confirmed finding is one where the rule is deterministic and the rendered page meets its condition without ambiguity. A response with no Content-Security-Policy header has no CSP; there is nothing to interpret. A form input with no label element, no aria-label and no aria-labelledby has no accessible label in the document; that is a fact about the DOM. Twenty-three of the twenty-five reported findings are of this kind.
Low text contrast is the first exception, and the gap is a feature of honest measurement. Contrast is computed from a foreground colour and a background colour. When the background is flat, the ratio is exact and the finding is Confirmed. When text sits over a photograph, a gradient or a semi-transparent layer, the effective background is not one colour, and the scanner reports the failure at a lower confidence and asks a person to look. On a design-led segment such as agency sites, where hero text over imagery is common, a few percent of contrast findings fall into that category, and in this sample that was eight sites or fewer.
The empty alt finding is the second exception and the clearer illustration. An empty alt attribute is correct for a decorative image: it tells a screen reader to skip it. It is a barrier when the image carries information, such as a chart or a logo used as the only label for a link. Whether an image is decorative is a judgement about meaning, not markup, and no automated rule can settle it. The scanner therefore flags likely informative images with empty alt text and declines to confirm a single one. That the finding appears on 3% of sites and is Confirmed on none is the method working as designed: it reports what it suspects and labels its suspicion as such.
Limitations
This section is detailed on purpose, because the value of a benchmark depends on the reader knowing exactly what it can and cannot support.
How far does a sample of 304 sites go?
A sample of 304 is large enough to estimate the prevalence of common findings to within roughly five percentage points either way, and the intervals given throughout reflect that. It is not large enough to estimate findings present on only a handful of sites, which is why twenty-eight findings were withheld, nor to compare subgroups of agencies (by size, region or platform) with any confidence, which is why the paper attempts no such comparison. A finding reported at 7% could sit anywhere from about 5% to 11% in the underlying population.
Is the sample representative of all web agencies?
It is not random, and the paper does not claim it is. Sites were selected as presenting themselves as web design or development agencies, from public directories and search results. That method favours agencies that are discoverable and that permit automated visits. Agencies whose robots directives disallow scanning were not scanned, and there is no basis for assuming their sites resemble those that were. The sample also accumulated over five weeks rather than being drawn at once, and the earlier 57 sites were chosen first. The results describe this sample and are offered as the best available estimate for the segment, not a census of it.
What does a front-page scan miss?
Only the front page was scanned. Findings that live on deeper pages, in transactional flows or behind a login are absent from the data, which is why the clean deceptive design result cannot be read as the absence of deceptive design. It also means a site whose front page is unusually good or unusually poor is represented by that one page. The front page is the page every visitor sees first and is a reasonable proxy for the attention a site receives, but it is not the site.
What can automated detection not see?
Every finding here is machine-detectable by construction, and automated detection has a ceiling. According to Deque's automated accessibility coverage report, automated tests identified 57.38% of total issues across more than 13,000 audited pages and page states, and estimates based on the number of WCAG success criteria are lower still. The accessibility scores in this paper are therefore a floor on the number of barriers, not a measure of it. A site that scored 96 is not 96% accessible; it is a site on which the automated rules found little. Keyboard traps, meaningless alt text, illogical focus order and colour used as the only carrier of meaning are failures a person finds and a scanner does not. We set out this boundary in our analysis of why a Lighthouse accessibility score of 100 is not WCAG compliance, and it applies with equal force here.
Does the timing of the scans matter?
Every figure describes a page as served on one day between 16 September and 23 October 2026. Pages change. A header added or a tracker removed the following week is not reflected here, and sites scanned at the start of the window may have changed by its end. The five-week window is short relative to the pace at which agency sites are redesigned, but it is not zero.
What does the exclusion of the authors' own site change?
As described in the methodology, removing one site from 305 can shift any count by at most one. Every share was checked against both possibilities and reported so that it is true in either case. Worst, median and best scores are computed over all 305 scans and could differ for the 304 only if the excluded site held the extreme value; in particular, the single front page that reached 100 in accessibility may or may not be the excluded site, which is why the paper says at most one third-party site reached full marks rather than exactly one.
Which claims does this data not support?
Several claims a reader might be tempted to make are not supported, and the paper states them plainly so that it is not cited for them. It cannot tell you which agencies are good or bad: no site is named and no site can be recovered. It cannot tell you that any site complies or fails to comply with any law, because compliance is a legal conclusion that depends on jurisdiction, the whole site and facts a scan cannot see. It cannot tell you that agencies are better or worse than any other professional segment, because no other segment was scanned with the same method in the same window; the comparisons with the WebAIM Million and the Web Almanac are directional only, across different tools and page sets. It cannot tell you anything about deceptive design in agency work. It cannot tell you the total number of barriers on any page, only the number a machine could detect. And it cannot tell you what these sites look like today.
Implications and recommendations
What should agencies fix first?
The data suggests an order of work. The two most prevalent findings are also among the cheapest to correct at the source. Low text contrast, present on 82% of sites, is usually a single colour token. A missing CSP, present on 61%, and a missing HSTS header, on 38%, are configuration on the server or CDN rather than changes to page code. An agency that resolved those three on its own site would, on this evidence, move from the middle of the sample toward the top in two dimensions.
The accessible-name findings come next: links without names on 39% of sites, form fields without labels on 20%, buttons without names on 12% to 13%. These are the failures screen reader users meet first, and each is a few attributes in a shared component. The consent findings are lower in prevalence but highest in legal exposure, and the fix is timing rather than design: nothing non-essential should load until the visitor has chosen. Because every finding in this paper is a defect in the page's source, none is resolved by adding a script on top of the page. Agencies that want the same findings for client sites can run website audits for agencies with the scanner used here.
How should this benchmark be used?
For anyone comparing a site against these results, the recommendation is to compare findings rather than scores. A site's own list of Confirmed findings can be set directly against the twenty-five reported here, because each is a named rule against a named standard. Dimension scores are the scanner's summary and travel less well between tools. A broader set of public figures on accessibility failure rates, for context beyond this segment, is collected in our web accessibility statistics for 2026.
For agencies that publish an accessibility statement, and 29% to 30% of the sample did not link to one from the front page, the findings here are the kind of known limitations a credible statement names. The structure of such a statement is set out in our step-by-step guide to writing an accessibility statement.
What should the next study measure?
Three extensions follow. A repeat of the same segment after an interval would turn this snapshot into a trend, and with the first study now superseded on precision, the natural comparison point is this paper. A sample of a different professional segment scanned the same way would allow the cross-segment comparison this paper cannot make. A scan that reaches beyond the front page, into contact and checkout flows, would test whether the clean deceptive design result survives contact with pages where deceptive patterns can actually occur.
Reproducibility
How can another team repeat this study?
The following is sufficient. Assemble a list of websites that present themselves as web design or development agencies, from public directories and search results, and fix that criterion before scanning. The authors' list is not published, because publishing it would identify the sites; any list built to the same criterion serves for replication.
For each site, run one read-only scan of the front page with a scanner that renders the page in a real browser and applies a fixed rule set across the six dimensions described above. Do not crawl, submit forms, click consent controls or log in. Honour each site's robots directives and record which sites were excluded on that ground. The Sitejar scanner performs this kind of scan and can be run on up to five pages without an account through the free scan on the homepage, or programmatically for larger samples through the interface described in the developer documentation.
If a site is scanned more than once in the collection window, keep the earliest complete scan and discard the rest. Exclude dry runs. Exclude any site belonging to the research team, and if counts were tallied before the exclusion, apply the bounding procedure described in the methodology so that every published share is true whether or not the excluded site carried a given finding.
For each dimension, record the worst, median and best score and the share of sites scoring below 100. For each finding, record the share of sites on which it appears and how much of that presence is Confirmed, with a 95% Wilson interval. Withhold any finding present on fewer than five sites. Name no site.
What exactly did the authors run?
The authors ran the scans for this paper between 16 September and 23 October 2026, with the production rule set current on those dates, against 305 front pages: 304 third-party agency sites and one site belonging to the authors, which was excluded. Twenty-eight findings were withheld under the five-site rule. No dry runs were found. The 57 sites of SJR-2026-001 are included, each represented by the same earliest scan. Other research papers in this series are listed on the Sitejar research papers page.
Frequently asked questions
How many websites were scanned for this study?
More than 300. The protocol scanned 305 front pages between 16 September and 23 October 2026: 304 third-party web agency websites plus one belonging to the authors, which was excluded. Each of the 304 was scanned once, on its front page only.
What is the most common problem on web agency websites?
Low text contrast, present on 82% of the agency front pages scanned (95% CI 77.5 to 86.1). It is also the most common failure across the top one million home pages, where the WebAIM Million 2026 found it on 83.9%, so on this failure agencies fail at a similar rate to the web as a whole.
Are web agency websites more accessible than other websites?
Partly. Agency front pages carried low contrast text at nearly the same rate as the web at large, but far fewer missing alt text and missing form label failures than the WebAIM Million reports. At most one of the 304 reached full marks in accessibility. The studies use different methods, so the comparison is directional.
How many agency sites track visitors before consent?
At least a fifth. A third-party cookie set before consent appeared on 21% to 22% of sites, and a tracking script loading before consent on 21%. Because the overlap between the two is not recorded, the share with either lies between 21% to 22% at the lowest and 42% to 43% at the highest.
How many web agencies use a Content-Security-Policy header?
About 39% of the agency front pages in this sample sent one; 61% did not (95% CI 55.6 to 66.5). That is a higher adoption rate than the 21.9% the HTTP Archive Web Almanac 2025 reports across the pages it crawled, but it still leaves a majority without the header.
Why did every site score 100 on deceptive design?
Because only front pages were scanned, and the deceptive patterns regulators pursue live in checkout, subscription and cancellation flows that an agency front page does not contain. The clean score means nothing was found where there was little to test. It is not evidence that these agencies never use deceptive patterns.
How does this study differ from the earlier 57-site benchmark?
It uses the same method on a sample about five times larger that includes the original 57 sites. The larger sample narrows every confidence interval, lifts ten more findings over the publication threshold and revises the missing CSP estimate from 70% to 61%. The other most common findings held up within the first study's margins; one smaller finding, keyboard-unreachable scrollable regions, came in lower.
Can I find out which agencies were scanned?
No. No site is named, no published row describes fewer than five sites, and twenty-eight rare findings were withheld so that no site can be identified from the paper.
What does Confirmed mean in this paper?
That the rule is deterministic and the failure is certain from the rendered page, such as a missing header or a form field with no label in the DOM. Twenty-three of the twenty-five reported findings were Confirmed on every site that carried them. Low contrast over images and empty alt text on possibly informative images were flagged at lower confidence for a person to review.
How can I compare my own site with this benchmark?
Scan your front page with the same kind of single-page, read-only method and compare your list of Confirmed findings against the twenty-five findings reported here, one by one. Comparing named findings is more meaningful than comparing scores between tools.
Conclusion
On a read-only scan of more than 300 web agency front pages in September and October 2026, at most one of 304 third-party sites reached full marks in accessibility, 91% fell short in security and 85% in privacy. Low text contrast was the most widespread failure, on 82% of sites, followed by a missing Content-Security-Policy header on 61%, links without a discernible name on 39% and a missing HSTS header on 38%. At least a fifth of sites began tracking before any consent choice. Deceptive design was clean and SEO nearly so, a result the paper attributes to what a front page can show an automated check, and declines to extrapolate.
Set against the largest public studies, the pattern is specific. Agency front pages carry low contrast text at a similar rate to the web as a whole, while showing far fewer structural accessibility failures and wider adoption of security headers. The one failure on which professionals perform like everyone else is the one that comes from visual design, and it is also among the cheapest to correct at the source. A sample five times larger than the first study's confirmed its most common findings within their margins and corrected two estimates. The method is published in full so that the study can be repeated, extended to other segments and turned from a snapshot into a trend.
References
WebAIM, The WebAIM Million 2026
HTTP Archive, Web Almanac 2025: Security
Deque, The Automated Accessibility Coverage Report
Sitejar, Transparency: how scores are calibrated
This paper is educational and reflects Sitejar's point of view. It is not legal advice. For your specific situation, consult a qualified attorney.